NASA SEES Internship · X-59 Team · July 2026
Reading a quiet boom
I built a repeatable chain from aircraft geometry to perceived sound, then used it to compare 101 pitch conditions for a X-59 research configuration.
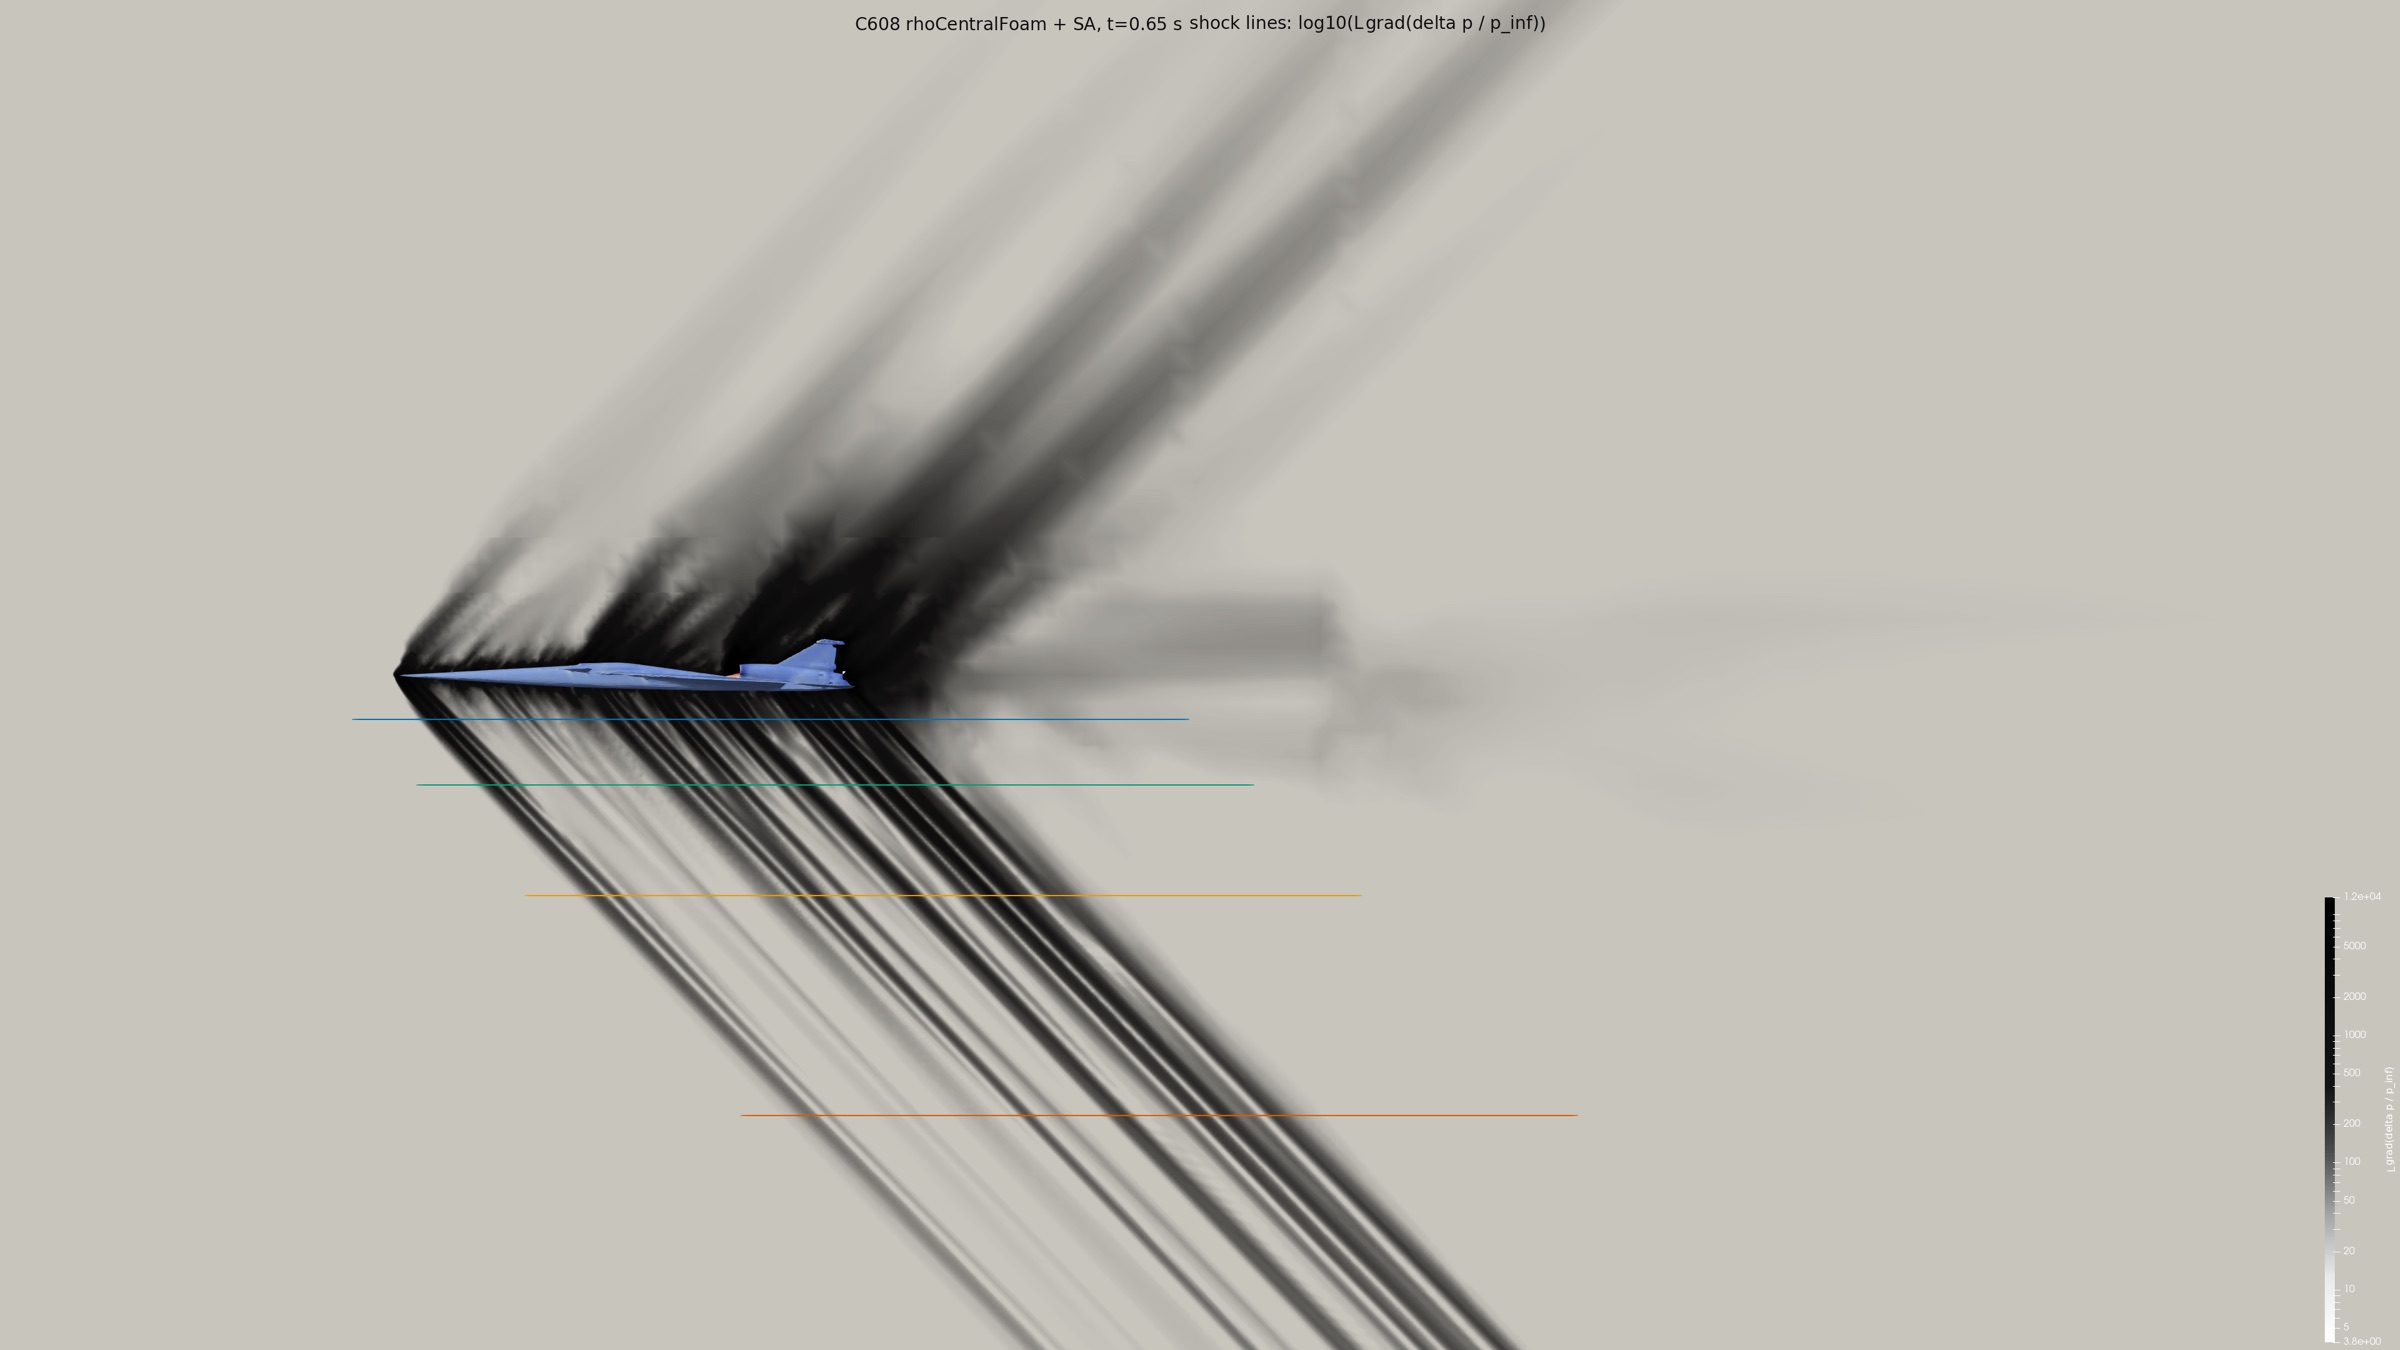
What happens to the computed boom when the same aircraft model is pitched from 0° to 5°?
The X-59 is designed so its shock waves reach the ground as a quieter thump instead of a conventional sonic boom. Pitch changes how the aircraft's pressure features line up, so it may also change the sound that reaches the ground to an observer.
We studied NASA's C608 workshop model at Mach 1.4. It is useful for computational research, but it is not the final flight aircraft. I therefore treat the sweep as a way to find patterns and select better experiments, not as a validated flight condition recommendation.
- Input
- Commanded geometric pitch from 0.00° to 5.00°
- Measured output
- Near-field pressure signature and incident perceived level
- Reference condition
- 2.15°, where the supplied C608 geometry is unchanged
The response is not monotonic. It falls toward a lower-response region near 1.75°, then rises steadily toward 5.00°.
A comparable path from geometry to sound.
The important part was keeping each result tied to the geometry, mesh, pressure source, and propagation run that produced it.
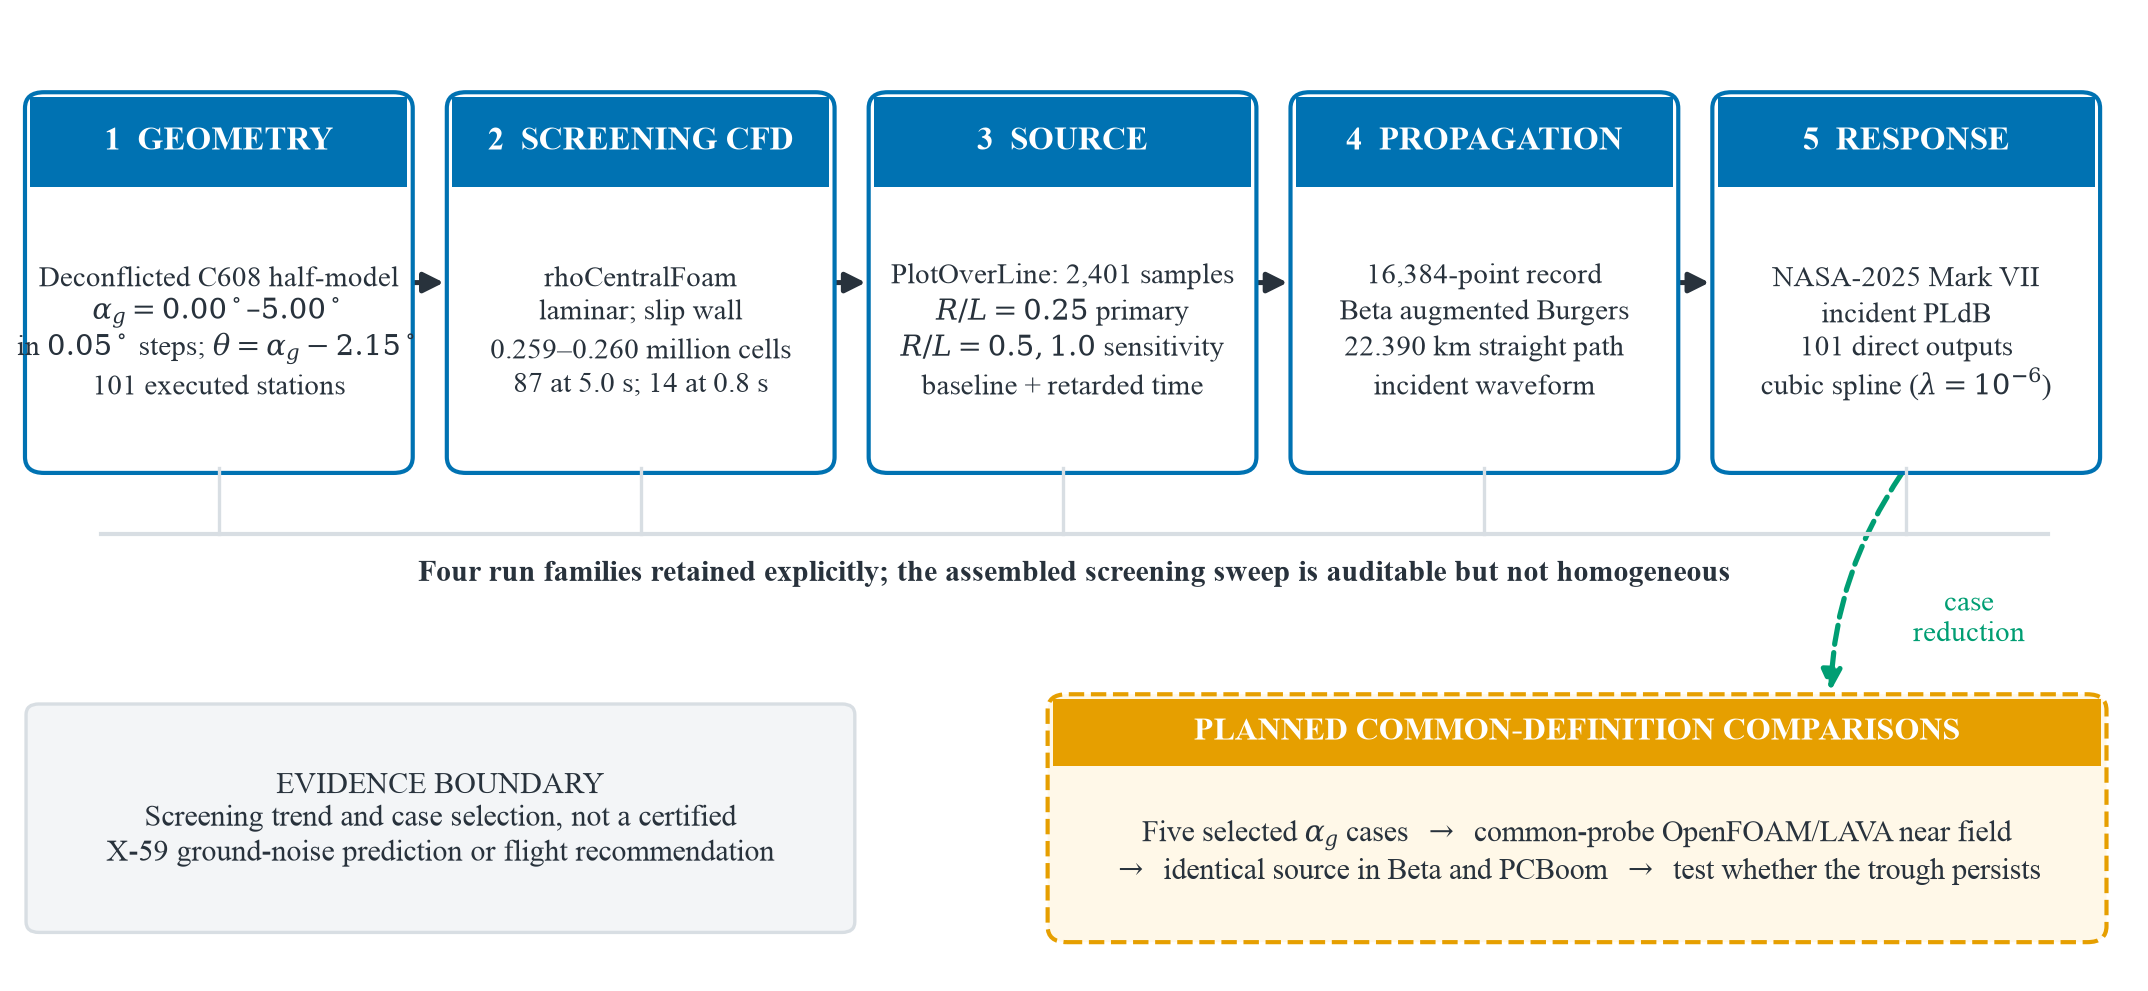
The dashed LAVA and PCBoom branch marks the next validation step; it did not generate the current curve.
- 01
Control the geometry
Rotate the same C608 half-model through 101 pitch conditions from 0.00° to 5.00° in 0.05° steps.
- 02
Run screening CFD
Remesh and solve each case in OpenFOAM while preserving the run, mesh, and recovery history behind every result.
- 03
Extract the pressure signature
Sample 2,401 on-track pressure values at a common aircraft-relative coordinate so the cases remain comparable.
- 04
Propagate it to the ground
Use a self-built augmented-Burgers model (named "Beta" as it's our second iteration) and NASA Mark VII procedure to estimate incident perceived loudness in PLdB.
Fine enough to reveal the shape of the response.
Pressure values extracted for every condition.
Straight Mach-angle screening path.
NASA Mark VII incident perceived level.
The lowest sampled response appears near 1.75°.
The fitted curve helps the eye follow the trend. The 101 direct samples remain the evidence; the fit is not an optimization claim.
1.75°
2.15°
5.00°
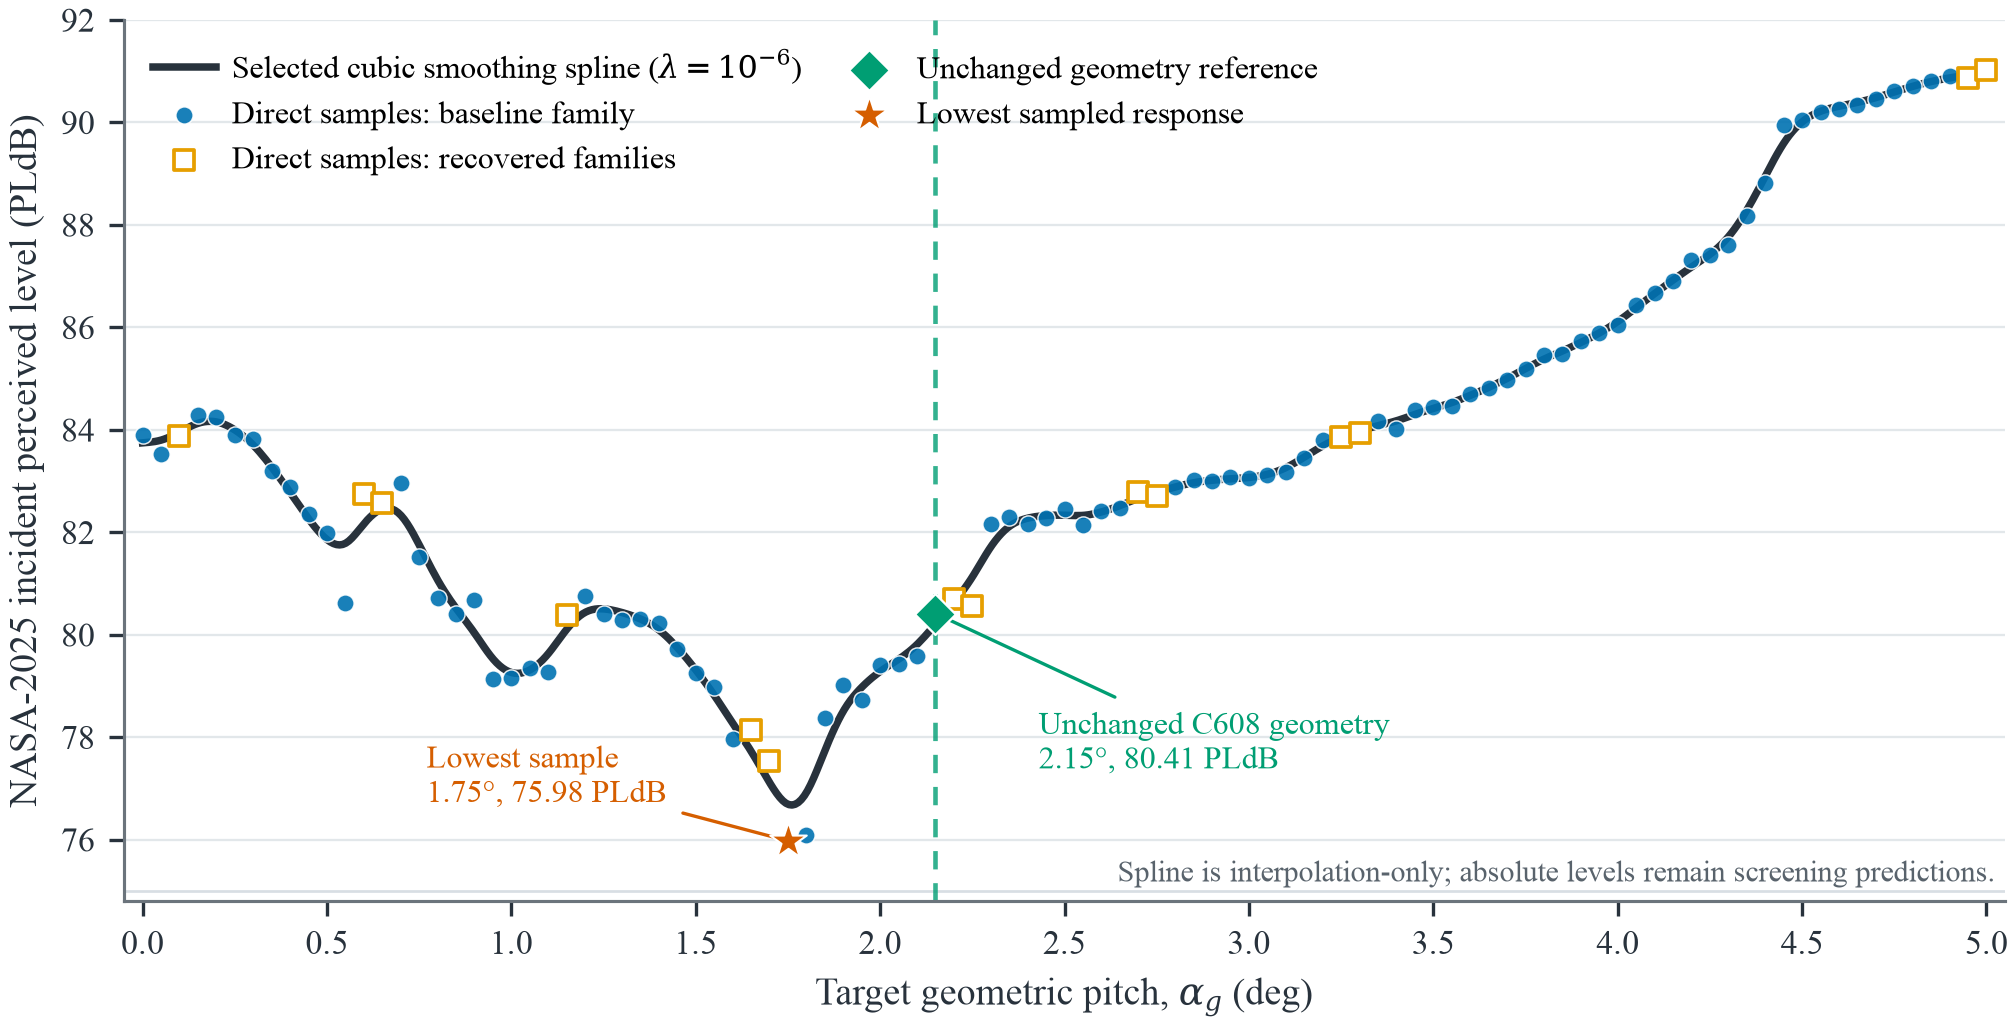
The curve falls, reaches a lower-response region, and then rises. The lowest point is a candidate for further testing, not yet a proven physical optimum.
The curve was only useful after I looked for ways it could fail.
The strongest sensitivity came from the location where the CFD pressure source was extracted, not from the propagation time grid.
Moving the extraction line changed the result enough that small differences between pitch cases should not be overinterpreted.
A separate RANS case at 2.15° tested a much finer mesh. It is one anchor, not a correction for the full sweep. At roughly 23 times the previous computed cell count, the case ran for 34 hours.
The refined waveform showed moderate gross agreement with a digitized NASA LAVA trace. That is context, not code validation.
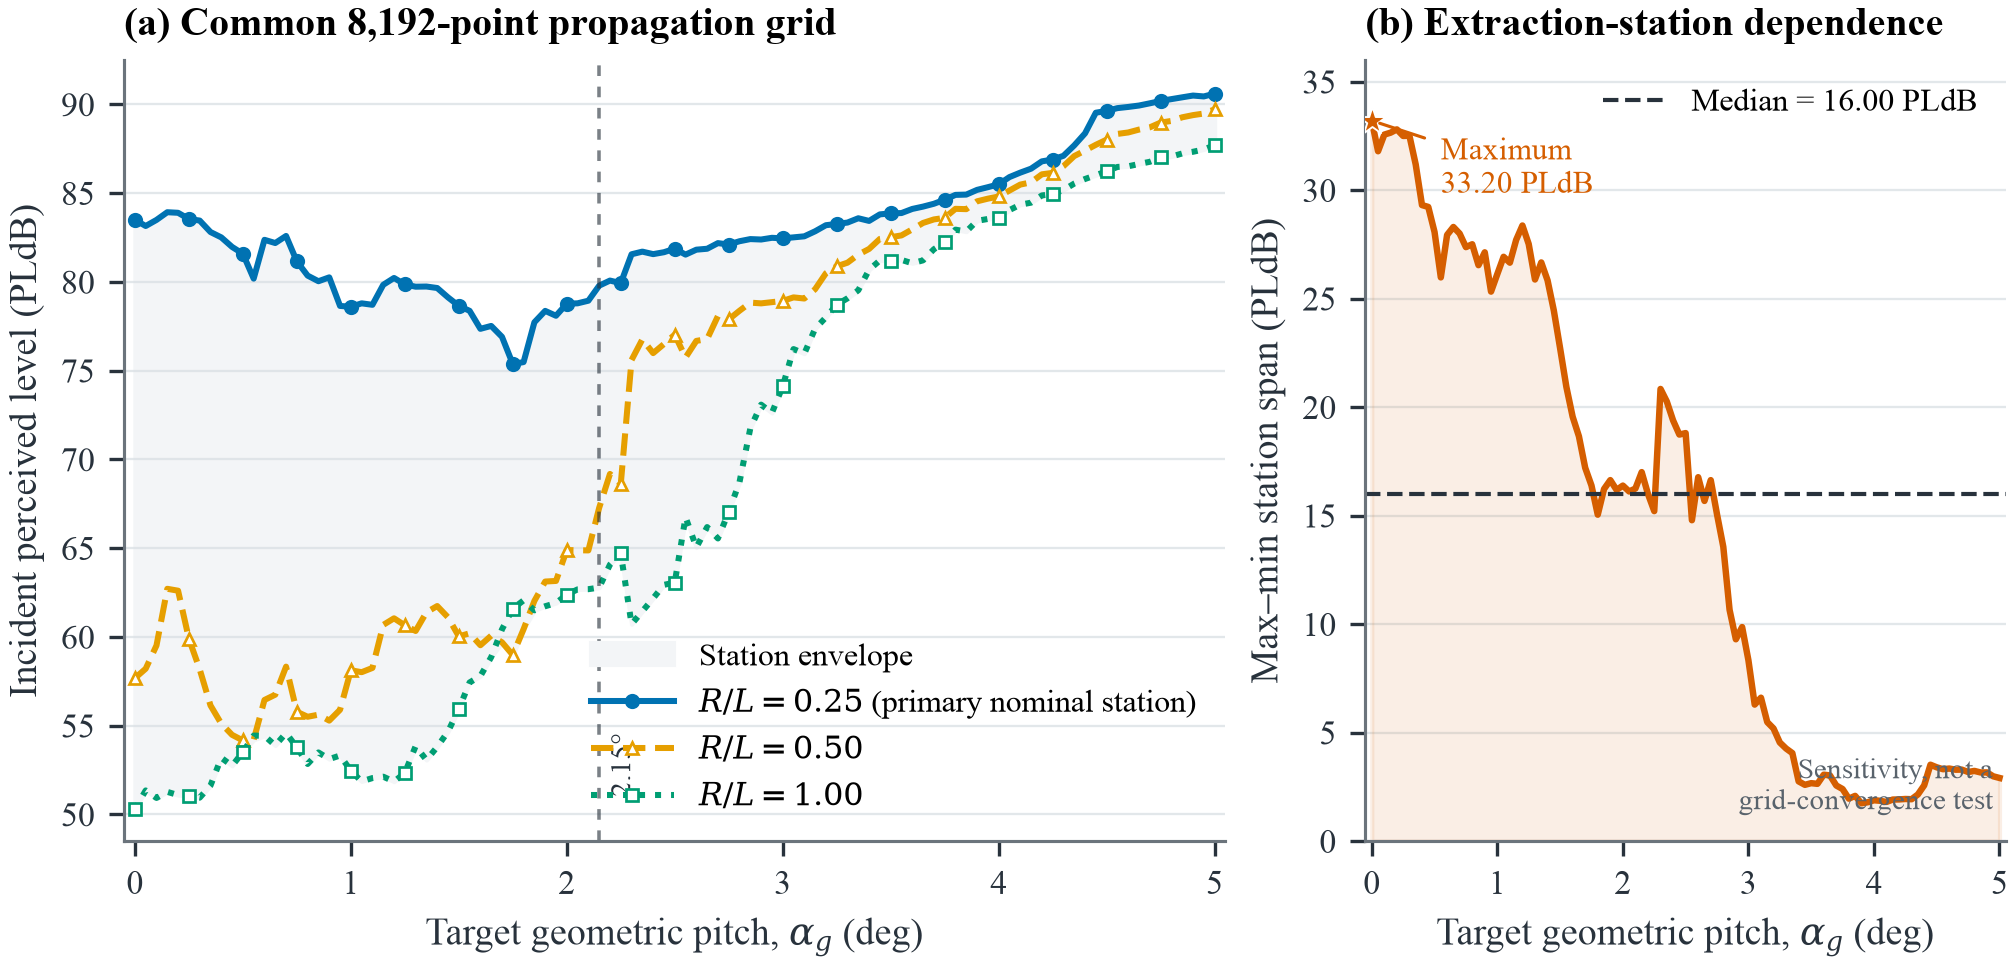
This comparison changed how I read the main curve. Before claiming small pitch effects, the pressure source must be controlled more carefully.
Useful for choosing the next experiment. Not ready for a flight claim.
The sweep identifies a pattern and the weakest parts of the workflow. It does not predict certified X-59 ground noise.
What I can say
The computed response changes systematically with pitch and contains a lower-response region worth retesting.
What I cannot say
That 1.75° is a physical optimum, a feasible flight state, or an absolute prediction of sound on the ground.
What comes next
Carry five representative cases into matched LAVA CFD and PCBoom propagation, one source of error at a time.
Limitations
The two-week program was constrained by the software and computing available. We used OpenFOAM rather than NASA's LAVA CFD framework, and our self-built augmented-Burgers propagation solver could not match the scientific fidelity available from PCBoom. Compute was limited to an M4 Max MacBook Pro and a single 96-core workstation.
Replication was difficult—at times, almost impossible. Yet within two weeks, we set up 101 cases and formulated a working augmented-Burgers equation set that could accomplish our goals. The result required considerable time and effort, but it looks extraordinarily promising for our purpose. We are excited to see how much further the project can go with better resources—and what the research community has to say about it.
A response map could become a planning tool—after validation.
The current sweep should not choose a flight condition. With feasible trim, atmospheric conditions, LAVA/PCBoom propagation, and flight validation added, the same framework could support several practical decisions.
Segment-by-segment pitch planning
Compare feasible AoA schedules across route segments, reserving lower-predicted-loudness settings for areas where ground exposure matters most while respecting lift, altitude, and control limits.
Community-aware route comparison
Overlay predicted loudness footprints with population, airspace, and noise-sensitive zones to compare candidate paths and avoid concentrating louder segments over dense areas.
Smarter high-fidelity testing
Use the low-, transition-, and high-response regions to select a small set of LAVA and PCBoom cases that can test whether the observed trend survives, rather than recomputing every angle first.
Aircraft and geometry trades
Repeat the CFD-to-PLdB loop under common conditions to compare candidate geometries—or other supersonic aircraft—by waveform structure and predicted loudness.